이 Post 는 Plotly.js 의 .NET Wrapper 인 Plotly.NET 의 사용 방법을 설명 합니다.
또한 C# 혹은 WPF 의GUI 에서 WebView2 를 사용해 Plotly.NET 으로 만든 그래프를 표시하는 방법 또한 설명합니다.
Plotly.js 라는 그래프를 그려주는 라이브러리가 있습니다.
JavaScript 로 사용할 수 있으며 Web 에서 쉽게 그래프를 그릴 수 있는 라이브러리 입니다.
.Net F# 에서도 Plotly.NET 이라는 Wrapper 가 있어 쉽게 사용할 수 있으며 Plotly.NET.CSharp 라는 Wrapper 가 있어 C# 으로도 쉽게 사용 할 수 있습니다.
……. 사실 Plotly.NET.CSharp 까지는 별로 필요 없이 Plotly.NET 만으로도 C#, WPF 에서 충분히 사용 가능 합니다.
Plotly.NET 은 그래프를 js 기반으로 작성한 후 Html 형태로 보여주거나 저장 합니다.
그래서.Show() 명령을 내렸을 때 임시 공간에 Html 을 저장한 후 브라우저를 띄워서 보여주게 됩니다.
그래프 작성이 너무 쉽고 가벼워서 .NET 에서 사용하고 싶지만 웹 기반이라 쉽게 GUI 에 넣기가 애매한 상황입니다.
하지만 Webview2 에 넣어서 보여주고, 그 외 몇 가지 자잘한 트릭을 쓰면 GUI 에 Embed 된 것 처럼 사용 가능 합니다.
작성한 Html 을 WebView2 를 사용해 보여주는 방식이기 때문에, C# 이던 WPF 던 관계 없이 정상 작동 합니다.
여기서는 오래간만에 C# WinForm 을 사용해 구현 해 봤습니다.
0. 패키지
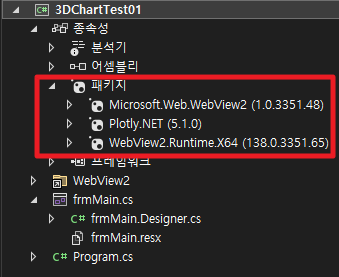
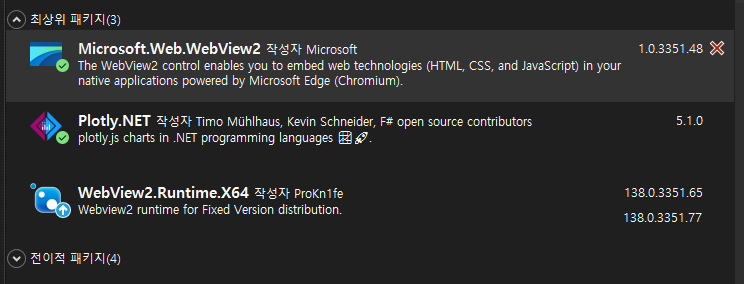
Plotly.NET 과 WebView2 를 사용합니다. Visual Studio 없이 단독 실행을 위해서는 WebView2 Runtime 도 설치 해 주셔야 합니다.
Plotly.NET.CSharp 는 Plotly.NET 을 보다 C# 스타일로 사용 가능하게 해 주는 Wrapper 입니다.
그리고 Plotly.NET 는 원래 F# 에서 주로 사용하긴 합니다.
하지만, Plotly.NET 만으로도 충분히 C# 에서 사용 가능 하기 때문에 여기서는 Plotly.NET 만 설치하고 진행 합니다.
1. GUI
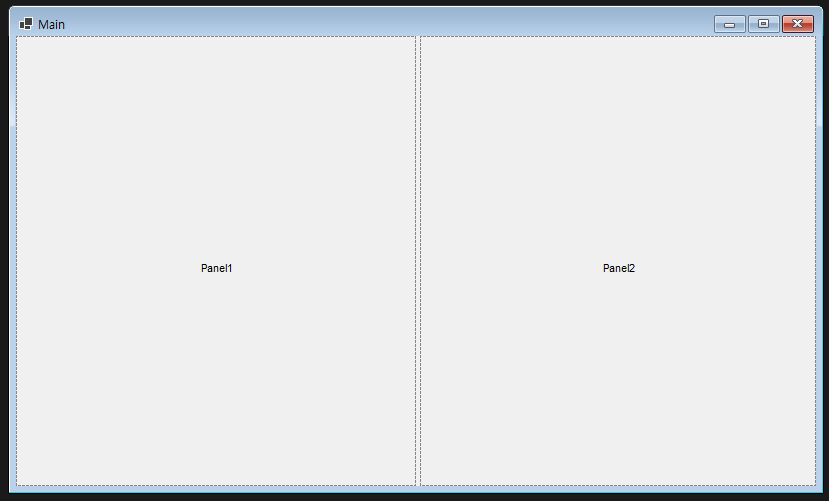
그냥 SplitContainer 를 하나 추가해 준게 전부 입니다.
2. frmMain.Designer.cs
#region Windows Form Designer generated code

/// <summary>
///  Required method for Designer support - do not modify
///  the contents of this method with the code editor.
/// </summary>
private void InitializeComponent()
{
	splitContainer1 = new SplitContainer();
	((System.ComponentModel.ISupportInitialize)splitContainer1).BeginInit();
	splitContainer1.SuspendLayout();
	SuspendLayout();
	//
	// splitContainer1
	//
	splitContainer1.Dock = DockStyle.Fill;
	splitContainer1.Location = new Point(0, 0);
	splitContainer1.Name = "splitContainer1";
	splitContainer1.Size = new Size(800, 450);
	splitContainer1.SplitterDistance = 400;
	splitContainer1.TabIndex = 0;
	//
	// frmMain
	//
	AutoScaleDimensions = new SizeF(7F, 15F);
	AutoScaleMode = AutoScaleMode.Font;
	ClientSize = new Size(800, 450);
	Controls.Add(splitContainer1);
	Name = "frmMain";
	Text = "Main";
	((System.ComponentModel.ISupportInitialize)splitContainer1).EndInit();
	splitContainer1.ResumeLayout(false);
	ResumeLayout(false);
}

#endregion

private SplitContainer splitContainer1;보통 디자이너 파일을 직접 수정할 일은 없긴 하지만 확인을 위해 코드를 적어 둡니다.
3. 초기화
Random random = new Random(Guid.NewGuid().GetHashCode() + DateTime.Now.Millisecond);

WebView2 webView0 = new WebView2();
WebView2 webView1 = new WebView2();

public frmMain()
{
	InitializeComponent();

	Directory.GetFiles(Environment.CurrentDirectory, "*.html")
		.ToList()
		.ForEach(file => File.Delete(file));

	splitContainer1.Panel1.Controls.Add(webView0);
	splitContainer1.Panel2.Controls.Add(webView1);

	this.Load += FrmMain_Load;
	this.Resize += FrmMain_Resize;
}WebView2 를 두 개 만들어 붙입니다.
Random 은 난수 데이터 생성을 위해 만들었습니다.
*.html 을 지우는 부분이 있는데, Plotly.NET 에서 스스로 그래프의 크기를 조절해주지 않아서 Main 창의 크기가 바뀔 때 마다 html 을 생성해서 바꿔치기 하는 방식으로 구현 했습니다.
때문에 html 파일이 쌓여서 시작할 때 마다 html 파일을 지워주는 부분 입니다.
사실 이 부분은 논란이 있기는 한데, 원래 크기를 Auto 로 하고 크기가 바뀔 때 마다 적용해주는 설정이 존재 합니다.
하지만 생성된 Html 을 열어보면 분명히 설정이 들어가 있음에도 의도한 대로 동작하지 않아 이런 식으로 구현 했습니다.
4. 그래프 그리기 함수 실행
private void FrmMain_Load(object? sender, EventArgs e)
{
	DrawPlot();
}

private void FrmMain_Resize(object? sender, EventArgs e)
{
	DrawPlot();
}

private void DrawPlot()
{
	splitContainer1.SplitterDistance = splitContainer1.Width / 2;
	ExampleScatterChart();
	ExampleConeChart();
}splitContainer 의 왼쪽 오른쪽 패널의 크기를 동일하게 맞춰주는 부분과 그리기 함수를 실행하는 부분으로 이루어져 있습니다.
5. 분산 차트
public void ExampleScatterChart()
{
	List<double> lstX = new List<double>();
	List<double> lstY = new List<double>();
	List<double> lstZ = new List<double>();

	for (int i = 0; i < 30; i++)
	{
		lstX.Add(random.Next(0, 100));
		lstY.Add(random.Next(0, 100));
		lstZ.Add(random.Next(0, 100));
	}

	var margin = Plotly.NET.LayoutObjects.Margin.init<int, int, int, int, int, bool>(
		0, 0, 0, 0, 0, true);

	var layout = Plotly.NET.Layout.init<string>(
			Margin: margin
		);

	int width = splitContainer1.SplitterDistance;
	int height = splitContainer1.Height;

	int plotlyScatterWidth = width - 16;
	int plotlyScatterHeight = height - 16;

	webView0.Width = width;
	webView0.Height = height;

	var chart = Chart3D.Chart.Scatter3D<double, double, double, string>(
		x: lstX.ToArray(), y: lstY.ToArray(), z: lstZ.ToArray(),
		mode: StyleParam.Mode.Markers,
		Name: "3D Scatter").WithMarkerStyle(
		Color: Plotly.NET.Color.fromARGB(128, 255, 0, 255),
		Size: 6)
		.WithLayout(layout).WithSize(plotlyScatterWidth, plotlyScatterHeight);

	string fileName = Guid.NewGuid().ToString() + ".html";

	chart.SaveHtml(fileName);

	webView0.Source = new Uri(Path.Combine(Environment.CurrentDirectory, fileName));
}14: 상하좌우의 마진을 없애고 그래프가 잘 표시가 안될경우 강제로 마진을 조절하는 플래그를 설정 합니다.
24, 25: 여백을 제외한 실제 그래프의 크기를 결정 합니다.
30: WithLayout 에서 마진을, WithSize 에서 그래프의 크기를 설정하여 그래프를 그립니다.
40: 그래프를 Html 로 저장합니다.
42: webView0 에 html 파일을 적용 합니다.
6. Cone 차트
private void ExampleConeChart()
{
	List<(double, double, double, double, double, double)> data = new List<(double, double, double, double, double, double)>();

	int x, y, z = 0;
	int u, v, w = 0;

	for (int i = 0; i < 30; i++)
	{
		x = random.Next(0, 100);
		y = random.Next(0, 100);
		z = random.Next(0, 100);
		u = random.Next(0, 10);
		v = random.Next(0, 10);
		w = random.Next(0, 10);

		data.Add((x, y, z, u, v, w));
	}

	IEnumerable<System.Tuple<double, double, double, double, double, double>> enumerableData =
		data.Select(d => new System.Tuple<double, double, double, double, double, double>(
			d.Item1, d.Item2, d.Item3, d.Item4, d.Item5, d.Item6));

	var margin = Plotly.NET.LayoutObjects.Margin.init<int, int, int, int, int, bool>(
		0, 0, 0, 0, 0, true);


	var layout = Plotly.NET.Layout.init<string>(
			Margin: margin
		);

	int width = splitContainer1.Width - splitContainer1.SplitterDistance;
	int height = splitContainer1.Height;

	int plotlyScatterWidth = width - 16;
	int plotlyScatterHeight = height - 16;

	webView1.Width = width;
	webView1.Height = height;

	GenericChart chart = Chart3D.Chart.Cone<double, double, double, double, double, double, string>(enumerableData, Text: "Cone Chart")
		.WithLayout(layout).WithSize(plotlyScatterWidth, plotlyScatterHeight);

	string fileName = Guid.NewGuid().ToString() + ".html";

	chart.SaveHtml(fileName);

	webView1.Source = new Uri(Path.Combine(Environment.CurrentDirectory, fileName));
}위와 동일한 내용 입니다. 설명은 생략 합니다.
7. 실행 결과
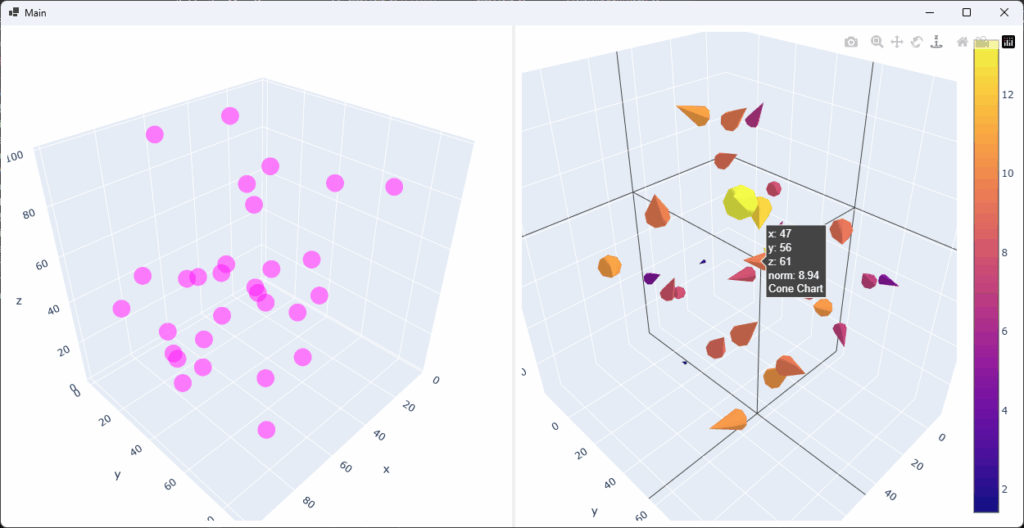
FrmMain_Resize 이벤트에 의해 창의 크기가 달라질 때 마다 그래프가 그려진 Html 파일을 생성하고 적용 합니다.
8. 크기 자동 조절 설정
var layout = Layout.init<string>(
		Margin: margin,
		AutoSize: true
	);

var config = Config.init(
	Responsive: true
);

//.WithLayout(layout).WithSize(plotlyScatterWidth, plotlyScatterHeight);
.WithLayout(layout).WithConfig(config);사실, 매뉴얼에 따르면 다음과 같이 설정 하였을 경우 크기가 자동으로 조절이 된다고 합니다.
직접 테스트 해 본 결과, Html 파일에 위 내용이 들어가 있음을 확인 했었음에도 크기가 자동으로 조절되지 않았습니다.
혹시 이 부분에 대해 아시는 게 있으시거나, 자동 조절을 성공하신 분은 알려주시면 감사하겠습니다.
궁금 하신 점이 있으시면 언제든 문의 주시면 답변해 드리겠습니다.