이 Post 는 WPF, C# 에서 2D Chart 를 그릴 때 자주 사용되는 OxyPlot 의 기초적인 사용법을 설명 합니다.
랜덤 값으로 막대 그래프를 그리고 Zoom 과 Pan 을 막거나 초기화 하는 방법 또한 설명합니다.
이전 Post WPF 2D Chart OxyPlot 사용법 – 꺾은선 그래프 (LineSeries) 에서 이어서 합니다.
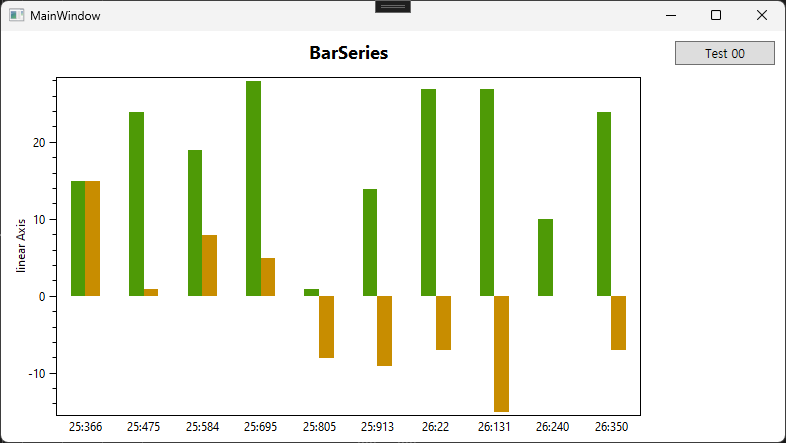
0. 수정 된 부분 – 막대 그래프(BarSeries)
private void BtnTest00_Click(object sender, RoutedEventArgs e)
{
	//plotView.Model = TwoLineSeries();
	plotView.Model = TwoBarSeries();
	CheckFirstPosition();
}

public PlotModel TwoBarSeries()
{
	PlotModel plotModel = new PlotModel();
	plotModel.Title = "BarSeries";

	var categoryAxis = new CategoryAxis();
	categoryAxis.LabelField = "Key";
	categoryAxis.AxislineStyle = LineStyle.Solid;
	categoryAxis.Key = "y";
	categoryAxis.MinorStep = 1;
	categoryAxis.TickStyle = TickStyle.None;

	for(int i = 0; i < 10; i++)
	{
		DateTime date = DateTime.Now;
		categoryAxis.ActualLabels.Add(date.Second + ":" + date.Millisecond.ToString());
		Thread.Sleep(100);
	}

	plotModel.Axes.Add(categoryAxis);

	var linearAxis = new LinearAxis();
	linearAxis.AxislineStyle = LineStyle.Solid;
	linearAxis.Title = "linear Axis";
	linearAxis.Key = "x";
	plotModel.Axes.Add(linearAxis);

	var barSeries1 = new BarSeries();
	barSeries1.Title = "BarSeries 1";
	barSeries1.ValueField = "Value";
	barSeries1.XAxisKey = "x";
	barSeries1.YAxisKey = "y";

	var barSeries2 = new BarSeries();
	barSeries2.Title = "BarSeries 2";
	barSeries2.ValueField = "Value";
	barSeries2.XAxisKey = "x";
	barSeries2.YAxisKey = "y";

	// Generate random data for the bar series
	for (int i = 0; i < 10; i++)
	{
		double y1 = random.Next(0, 30);
		double y2 = random.Next(-15, 20);

		BarItem barItem1 = new BarItem();
		barItem1.Value = y1;
		barItem1.CategoryIndex = i;
		barSeries1.Items.Add(barItem1);

		BarItem barItem2= new BarItem();
		barItem2.Value = y2;
		barItem2.CategoryIndex = i;
		barSeries2.Items.Add(barItem2);
	}

	plotModel.Series.Add(barSeries1);
	plotModel.Series.Add(barSeries2);

	return plotModel;
}3~4: 기존 LineSeries 만드는 부분 대신 BarSeries 를 만드는 함수를 호출 합니다.
13~25: LineSeries 와는 달리 BarSeries 에서는 CategoryAxis 가 필요 합니다.
16, 32: categoryAxis 가 x 이고 lienerAxis 가 y 일것 같은데 반대네요? OxyPlot 에서는 value 가 x 축에 있는 수평 막대 그래프가 일반적인 형태 인가봅니다. 실제 OxyPlot 예제 프로젝트 에서도 막대 그래프는 수평 막대 그래프가 대부분을 차지 합니다.
CategoryAxis 는 string 형태이기 때문에 어떤 값이던 들어갈 수 있습니다. 그리고 BarItem 에 CategoryAxis 의 Index 를 지정하는 형태로 그래프가 구성됩니다.
LineSeries 와는 전혀 다른 구성인데, 이렇게 하면 훨씬 더 자유롭게 x 축 혹은 y 축을 구성 할 수 있게 됩니다.